Static dashboard
Identify and structure a predefined and persistent set off items within a dashboard.
Identify and structure a predefined and persistent set off items within a dashboard.
The objective of the content on a dashboard page is to provide information that can be consumed quickly, with minimum interactions or cognitive processing. Users should glance at the dashboard and immediately see answers to questions.
When you structure the content for your dashboard page, think about your user's objectives. Answering these common questions can help you do this:
Highlight: What data is most likely to change regularly, or change in a way that is significant to users?
Focus: What data is important to communicate to users, and what are the best ways to make it prominent?
Usage across devices: Will your users view the dashboard on different devices? If so, how does this affect the complexity of the data represented and the user interaction with it?
Frequency: How often would your users refer to the dashboard?
Context: What information is needed to make a metric understandable?
Use research methods and metrics to define what type of content is relevant for your users.
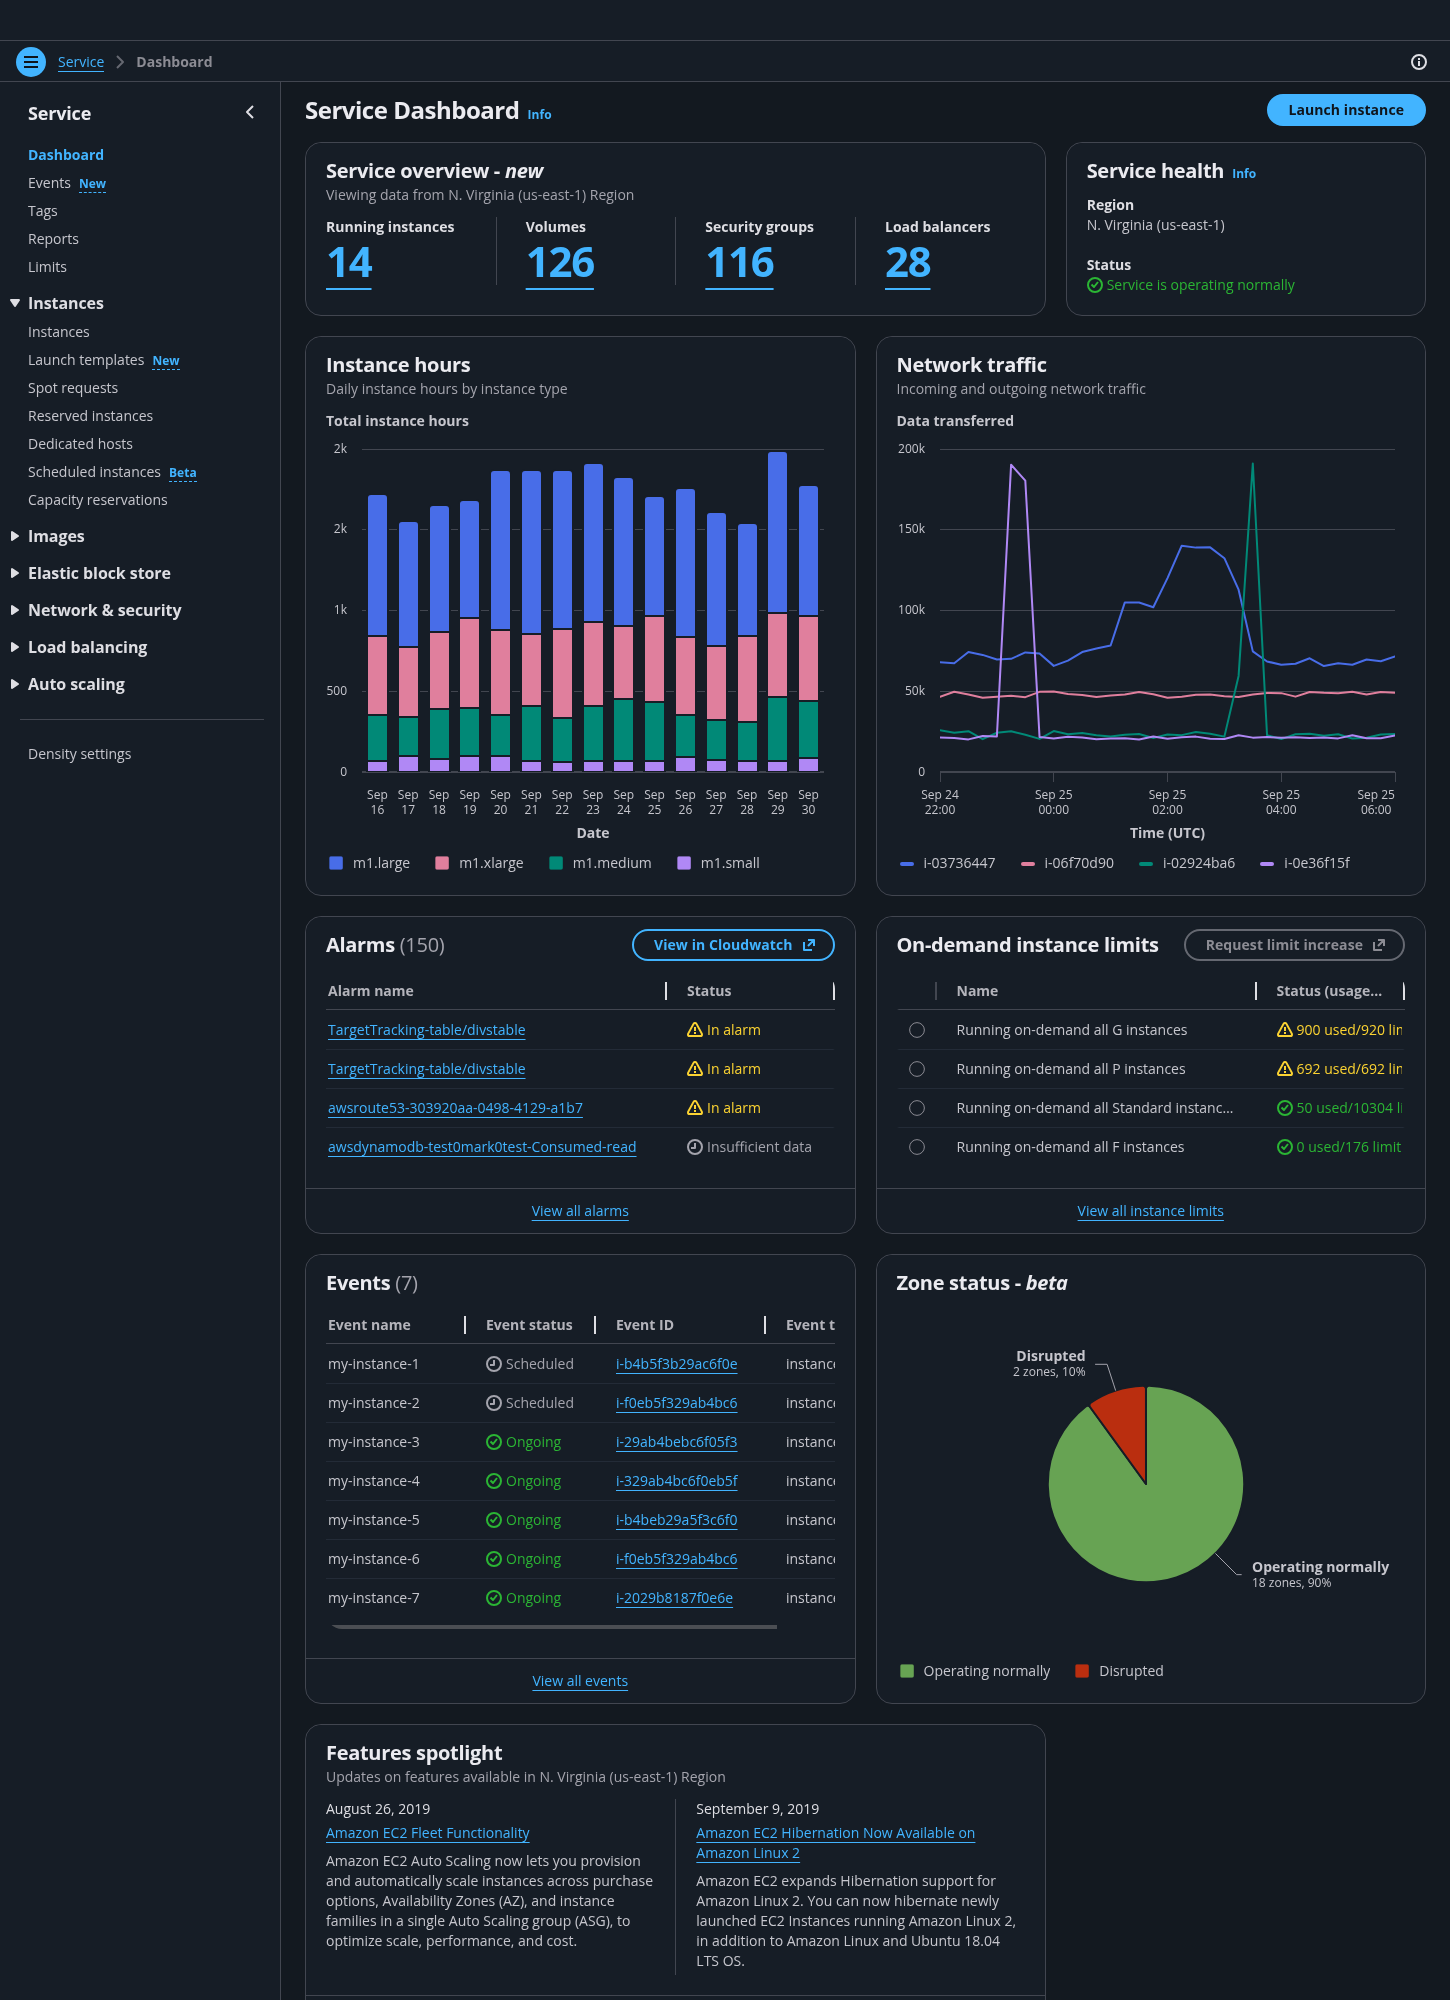
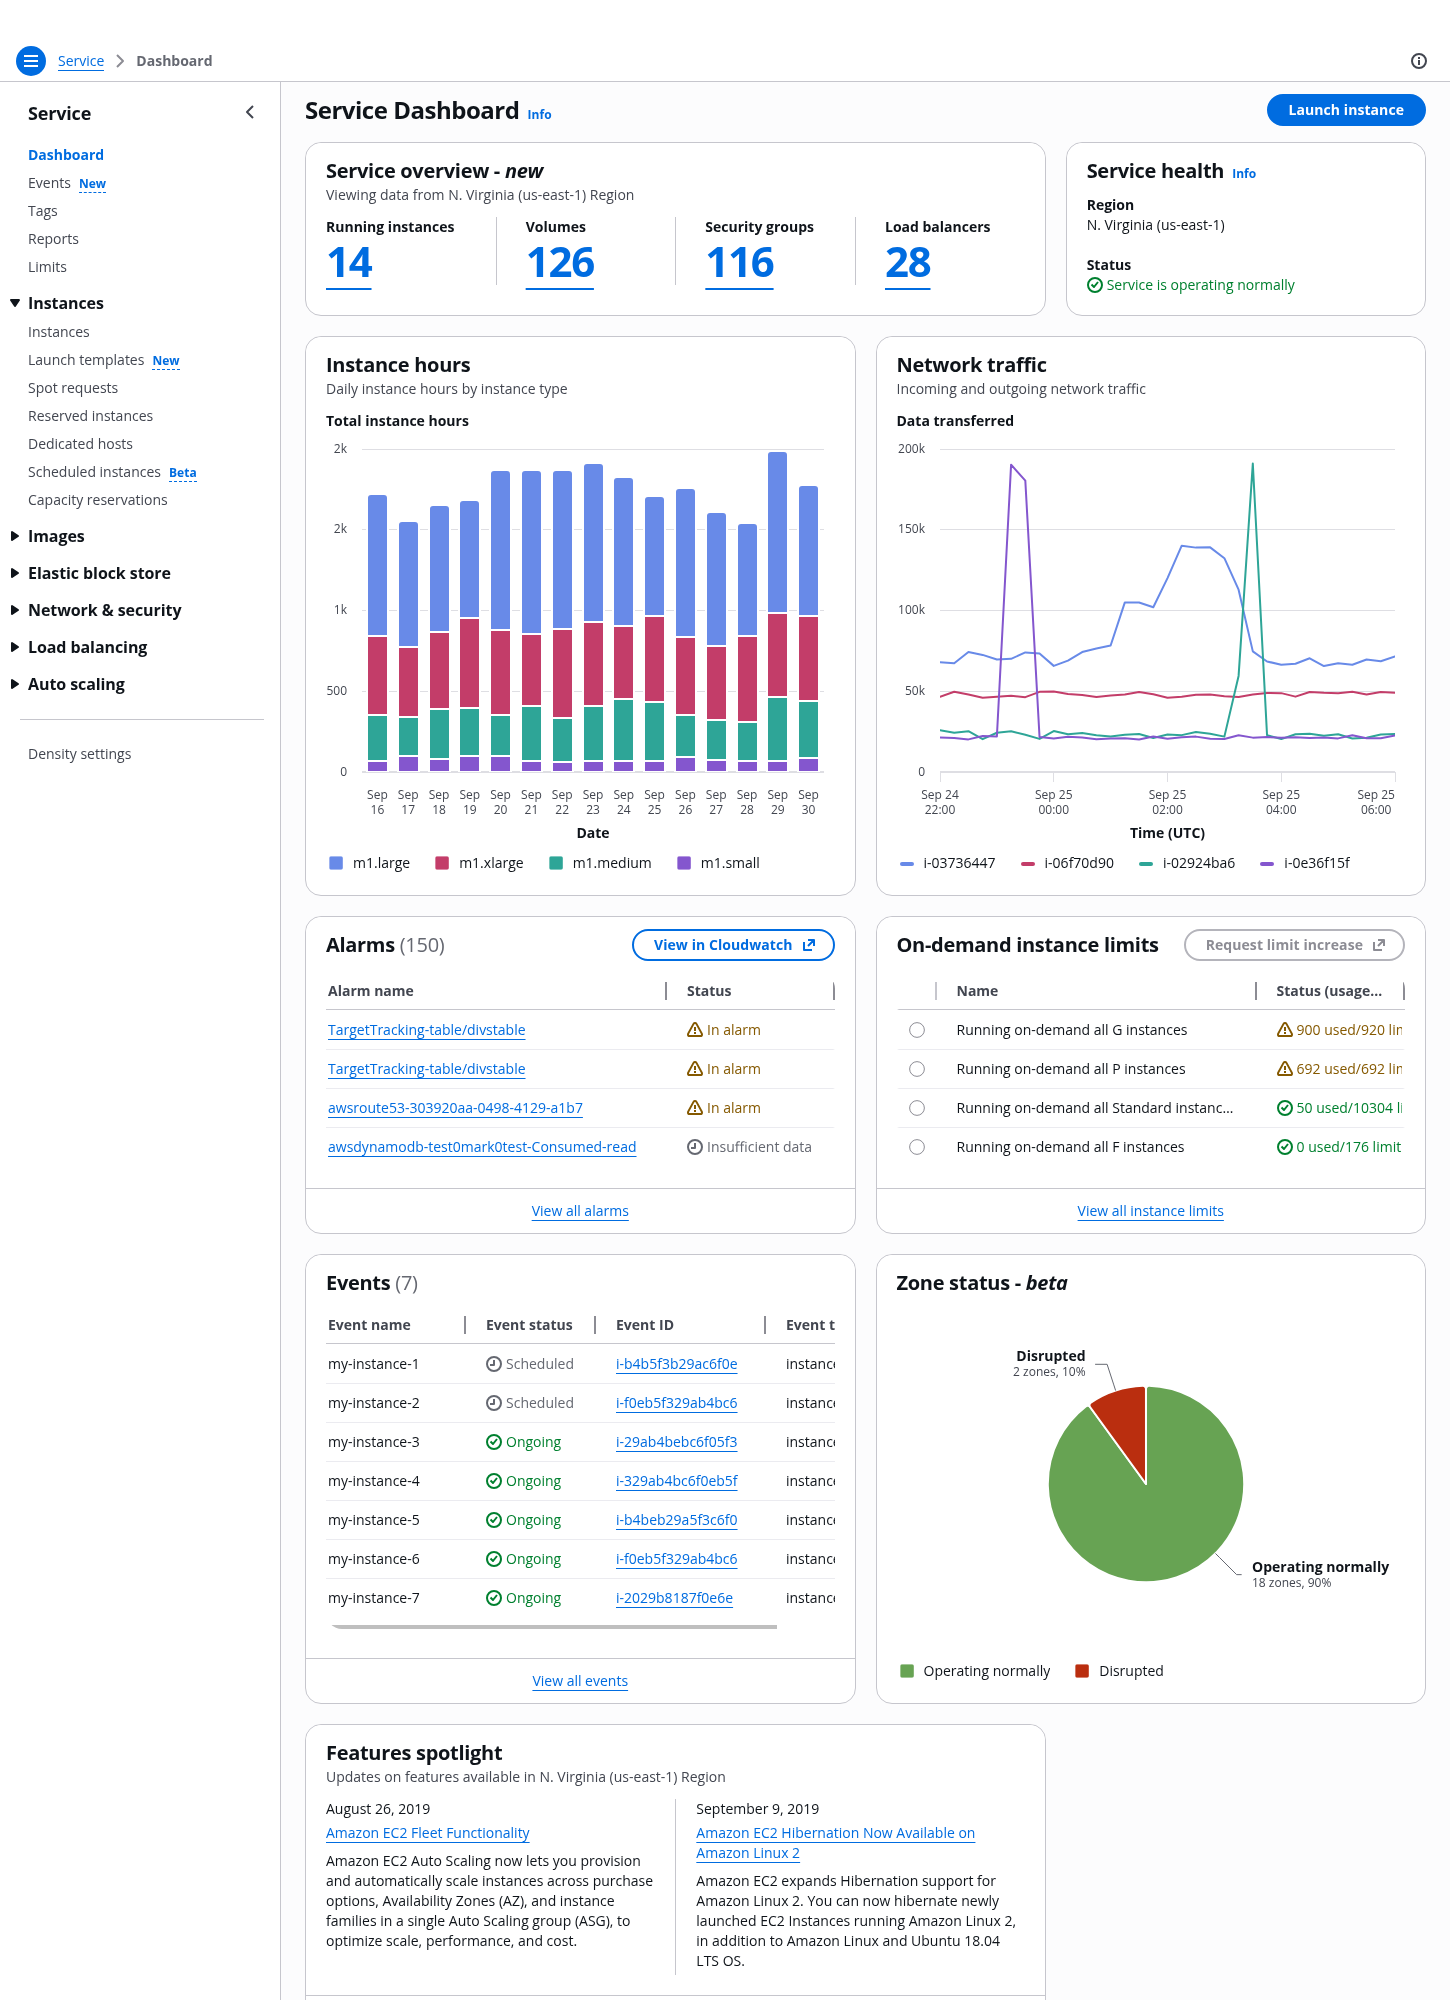
The content of your dashboard page should be distributed following a hierarchical order of importance so that it conveys the key information of your service in a simple format. For an example of a dashboard, see our demo service dashboard.
In a typical dashboard, there are three main areas that you can use to divide the content:
Use the top area of the page to provide the most significant and high-level insights that users need to be aware of at first glance. Include actions that are used to control the content of the page.
The following are examples of content types for the service overview area:
Actions that affect data displayed on the page or that allow users to create the main resource type for a service which will be displayed on the dashboard. For example: Filter by region, launch an instance, or add a widget
You can provide status information on a service level, such as displaying service health information. Or you can provide it on a particular set of resources, such as the scores of the most important resources.
Use the middle area of the page to display data that provides context to the top page insights, via dashboard items. Users can monitor the service status and investigate to perform issue resolution.
The following are examples of content types for service data area:
By using charts, users can compare data series throughout a period of time, against other data series, or to quickly parse a specific value of high importance.
For information about creating charts, see the data visualization guidelines and our data visualization components.
Lists are a collection of data in a tabular format that users can explore in depth. This format is effective for quickly identifying categories, comparing values in a large dataset, or accessing detail pages.
Use the bottom of the page to group information about updates and communications important for your users, which help them in optimizing the service. To support your users in being successful in understanding and setting up the service, use the help panel.
The following are examples of content types for service support area:
Group the information regarding service updates or service technical details that you want to communicate to your users. Provide links to external documentation so that users can find more information using the `primary` variant of normal and external link as applicable. For example, a new feature that empowers users with more control over their resources, or technical information about regional support.
You can provide a summary of information that helps new users to understand and set up the service. For example, links to technical documentation that explain how to use the service, or step-by-step configuration instructions to set up and run the service for first-time users.
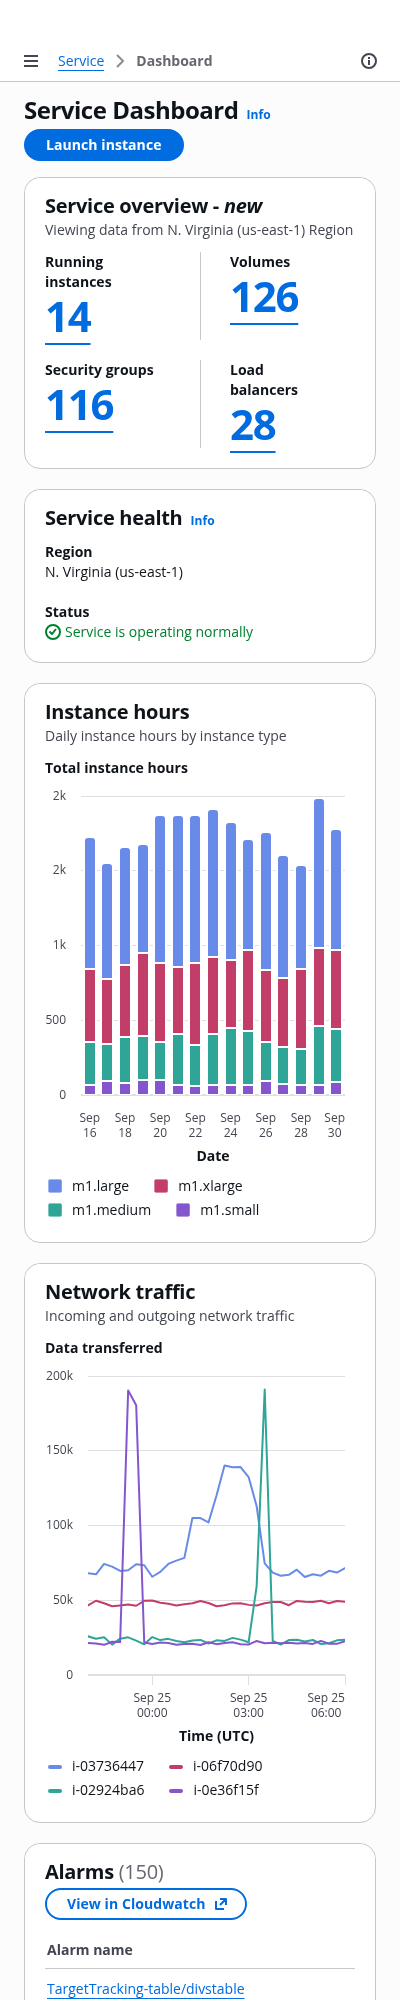
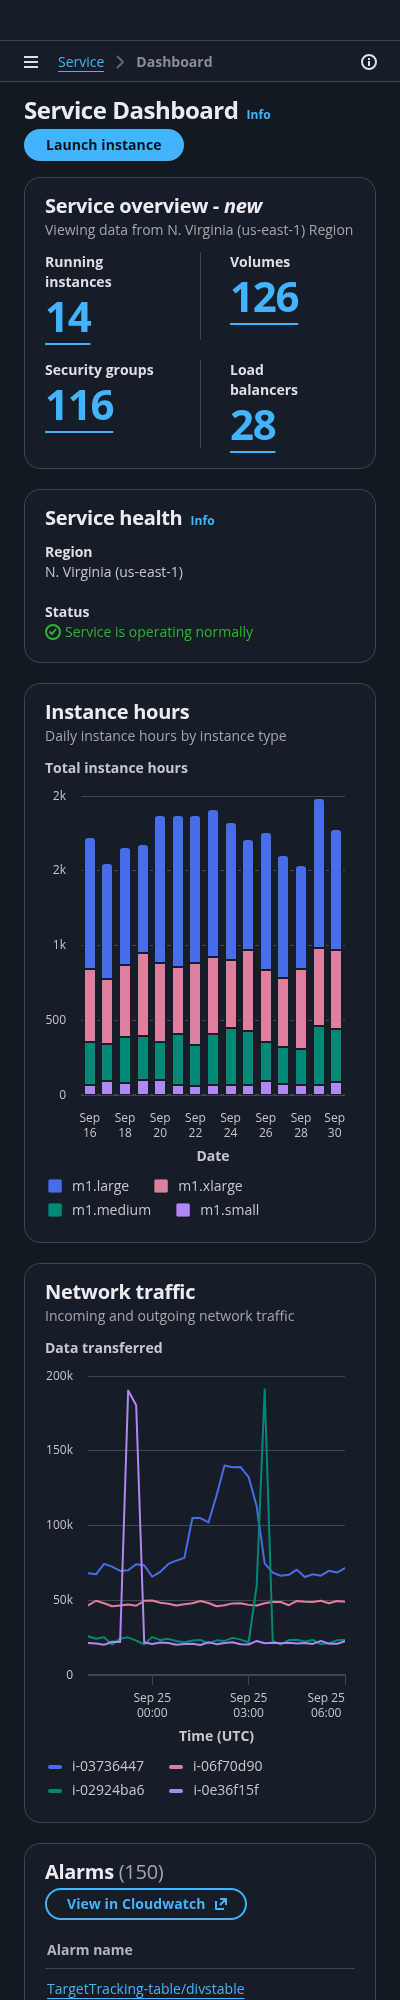
When structuring the dashboard layout consider cross-device experience. Users accessing the page on a smartphone primarily want to monitor the service status, and have access to meaningful and actionable information.
Use areas to define the stacking behavior of the components in smaller viewports.
Avoid data intensive charts to not compromise touch interactivity, instead provide access to a detail view of the data presented.
Dashboards have a primary goal to communicate critical information. There are two categories of business intelligence dashboards that are generally used for this: operational and analytical.
Operational dashboards: aim to impart critical information quickly to users as they are engaged in time-sensitive tasks. They present data deviations, show current resources and their status. They help users to be quick, proactive, and efficient in managing day-to-day business occurrences.
Analytical dashboards: provide the user with at-a-glance information used for analysis and decision making, often including features like drilling-down and ad-hoc querying. They help users to investigate trends, predict outcomes, and discover insights in the past and in the future, by using historical data.
We recommend to refer to the above categories to orient the content towards an operational or analytical approach. However, due to the variety of users interacting with a dashboard page, you can consider a mixed approach when defining the content for your dashboard, by providing both operational and analytical information across the page.
A dashboard page should never be overwhelming. Users expect it to provide key information to monitor, manage, and optimize, but they also use ad-hoc solutions to get the supplementary information they need, for example by using 3rd party tools.
Cognitive best practices consider seven (plus or minus two) as the number of images a brain can comprehend in one time. Consider seven as the limit number for data representation in your dashboard, as well as of items within a list or a graph.
Clutter and visual noise can distract your users in achieving their goal. Consider providing filter mechanisms, or break your dashboard into two or more separate dashboards.
If you opt to provide multiple dashboards your objective should be to group the right type of data within a dashboard page based on your users needs, and to establish parent-child relationship between the dashboards which align with your service architecture. For example, provide a parent dashboard for an overview of key insights related to your service, and a child dashboard to represent key insights relative to a specific set of resources.
The content of the dashboard page should be easy to understand, follow a logical order, and convey the right information for your users.
A user should be able to find the most relevant information on the dashboard within a few seconds. The most important and frequently needed metrics should be easy and quick to parse. Other tasks, such as ad-hoc investigation, can take longer.
To define the format for the data you’re going to display, begin with your user’s needs, and then choose the appropriate data representation type according to its purpose. Follow the guidelines for data visualization.
Avoid displaying long lists of data such as logs. Also, reduce the level of interactivity of the components, such as complex filtering on a table or a graph. Keep in mind that the user goal is to have a quick overview of the service status, so provide access to detail pages or cross-service navigation where the user can explore further.
Use sentence case, but continue to capitalize proper nouns and brand names correctly in context.
Use end punctuation, except in headers and buttons. Don’t use exclamation points.
Use present-tense verbs and active voice.
Don't use please, thank you, ellipsis (...), ampersand (&), e.g., i.e., or etc. in writing.
Avoid directional language.
For example: use previous not above, use following not below.
Use device-independent language.
For example: use choose or select not click.
Follow the guidelines on alternative text and Accessible Rich Internet Applications (ARIA) regions for each component.
Make sure to define ARIA labels aligned with the language context of your application.
Don't add unnecessary markup for roles and landmarks. Follow the guidelines for each component.
Provide keyboard functionality to all available content in a logical and predictable order. The flow of information should make sense.